SBCP
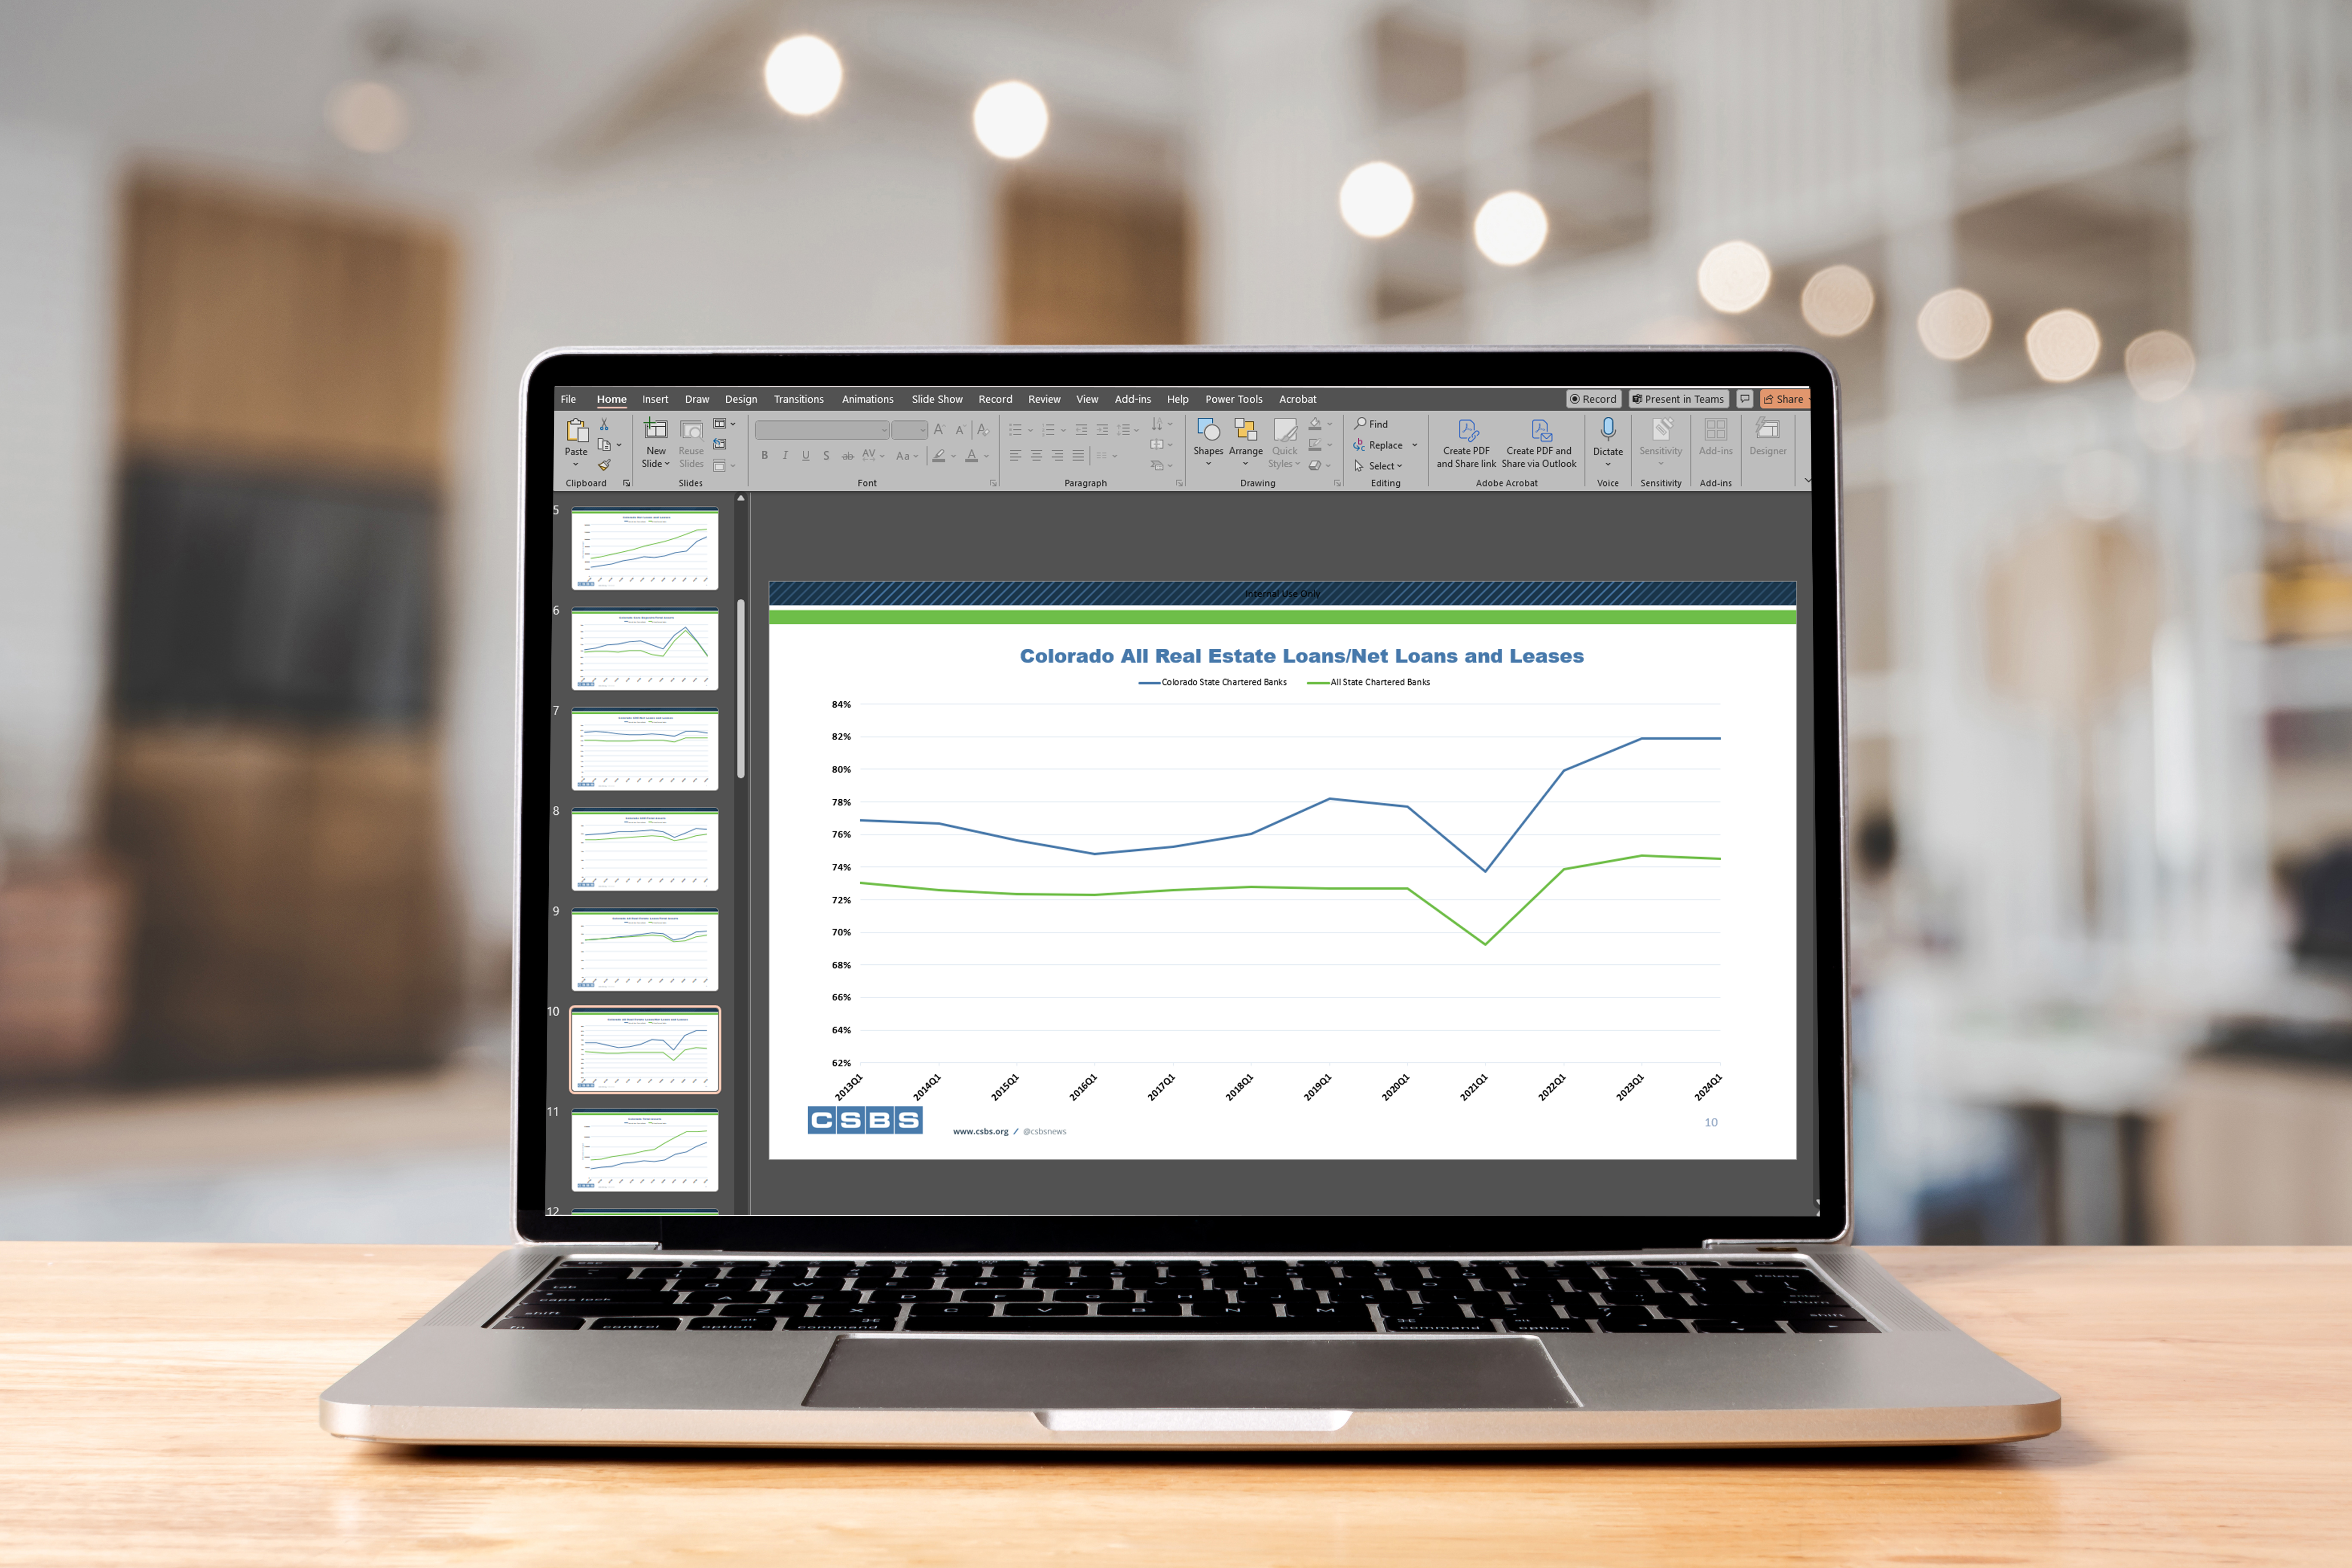
This PowerPoint deck features a series of charts and graphs showcasing UBPR metrics, providing an in-depth view of the health of individual banks.
Supervisory Function
Industry Overview
Audience
Exam Management
Industry
Bank
This PowerPoint deck features a series of charts and graphs showcasing UBPR metrics, providing an in-depth view of the health of individual banks.
Industry Overview
Exam Management
Bank
During an in-person meeting of the Data Working Group in April 2019, working group members agreed on two tools/products that would be immediately helpful to a wide range of CSBS members. The first being the Excel Risk Scoping Workbook (ERSW), an Excel-based tool, which CSBS successfully launched in August 2019. The second tool agreed upon by the Data Working Group was a tool to streamline the data visualization process for state-bank performance metrics. The CSBS Analytics team developed the State Bank Chart Pack to meet this need. The chart pack contains quarterly updated banking industry charts and graphs for use in reports, websites, presentations, and more.
To help familiarize users with the specifics of this tool, we've assembled a list of helpful FAQs.
The components of the State Bank Chart Pack are an Excel Workbook and a slide deck, available in both PowerPoint and PDF format.
Excel Workbook
The Excel Workbook is comprised of multiple tabs but includes all relevant data, charts, and tables in the “Main Tab-Chart Pack” tab. In the first row of the “Main Tab-Chart Pack” tab there is a drop-down list (cell B1) that allows the user to select their state. Once selected, all the information in the tab will update to display data that is only relevant for the selected state. The tab includes a set of charts that compare an individual state’s average to the overall national average over time for 27 key metrics. There are three additional charts included which only compare several state or national metrics to each other rather than state vs national. Towards the bottom of the “Main Tab-Chart Pack” tab there are 12 data tables that display the top 10 and bottom 10 banks in a state referencing 6 key metrics. These tables are also available in the “Top Bottom” tab. Additionally, in response to member requests we are also producing versions of the Excel file specific to Savings Banks and Commercial Banks.
PowerPoint and PDF Slide Deck
All charts present in the Excel file are also in a slide deck available in both PowerPoint and PDF format. By providing the slide deck in familiar formats users can leverage the charts for reports and presentations.
While most of the charts are aggregated to the state level, there is also a bank-specific "Top Bottom" tab which shows the top 10 and bottom 10 banks in your state based on ROAA, Total Assets, Total Deposits, Tier One Leverage Ratio, Net Loans and Leases, and Net Interest Margin (12 tables total). Several members of the Data Working Group who were involved in the testing process for this tool have indicated that they find these rankings incredibly useful and plan to incorporate them into their quarterly surveillance process so that examination staff can monitor when new institutions enter or exit the lists. The Top 10/Bottom 10 tables are accessible thought the "Top Bottom" tab in the Excel workbook, but are not currently part of the slide deck integration.
CSBS will be updating the chart pack each quarter and delivering the new versions straight to your inbox. If you are a deputy, commissioner, or member of the Data Working Group, you will automatically be added to the distribution each quarter. If you are not part of this group and want to receive the chart pack, there is a sign-up form on the bottom of this page.
The source data for the charts come from the Call Report/UBPR and are non-seasonally adjusted. To account for seasonal variation between quarters, the chart pack only displays data from the same quarter each year. For example, in Q3 the charts will show data points from Q319, Q318, Q317, etc. only, so that all the comparisons are year-over-year. If you would like a year-end version of the chart pack, please reach out to the CSBS Analytics team at data@csbs.org.
Each data element in the State Bank Chart Pack is mapped to a specific UBPR or Call Report metric. A list of the specific code mappings between the workbook and the UBPR / Call report is available in the "Data Dictionary" tab of the Excel Workbook or can be accessed by clicking here.
If you would like to provide feedback about the State Bank Chart Pack, or would like to suggest additions to the next version, you can submit your feedback using this form.