Supervisory Function

NonbankNEW!

Focused on the nonbank financial sector, this section features reports on Money Service Businesses, Mortgage activity, and NMLS Licensing Management. These resources provide regulators with insights into financial conditions, market activity, and licensing to better supervise and assess nonbank institutions.

Money Service Businesses

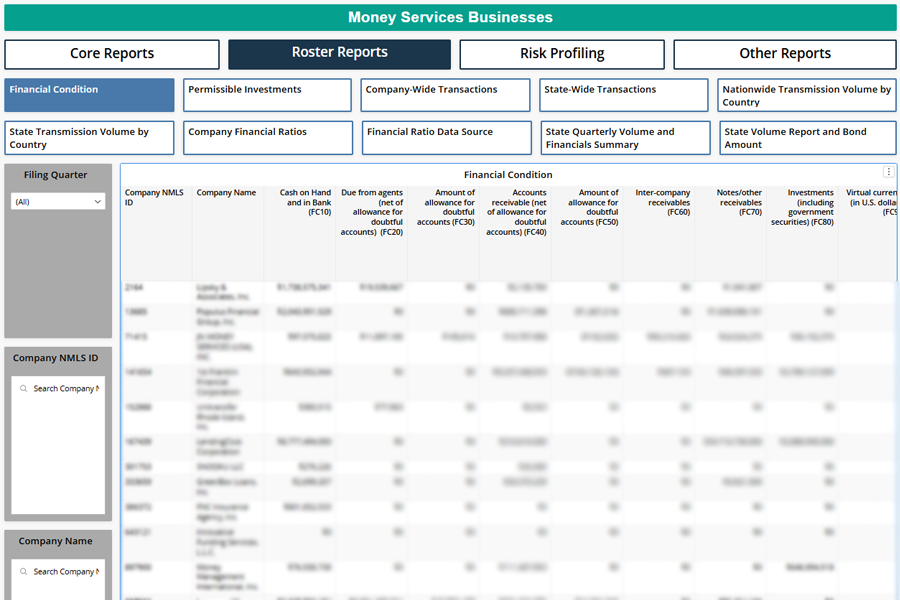
This dashboard has 25+ pages focused on financial conditions, transactions, investments, and risk profiling for Money Service Businesses at company, state, and national levels.

Mortgage

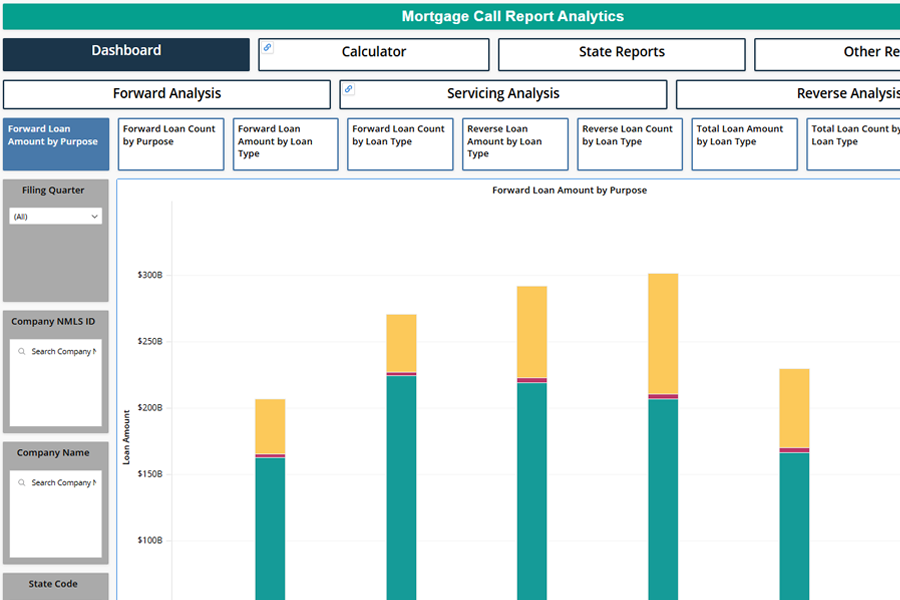
This dashboard has 20 interactive pages designed to analyze mortgage activity, loan volumes, servicing, and financial conditions across the market.

NMLS Licensing Management

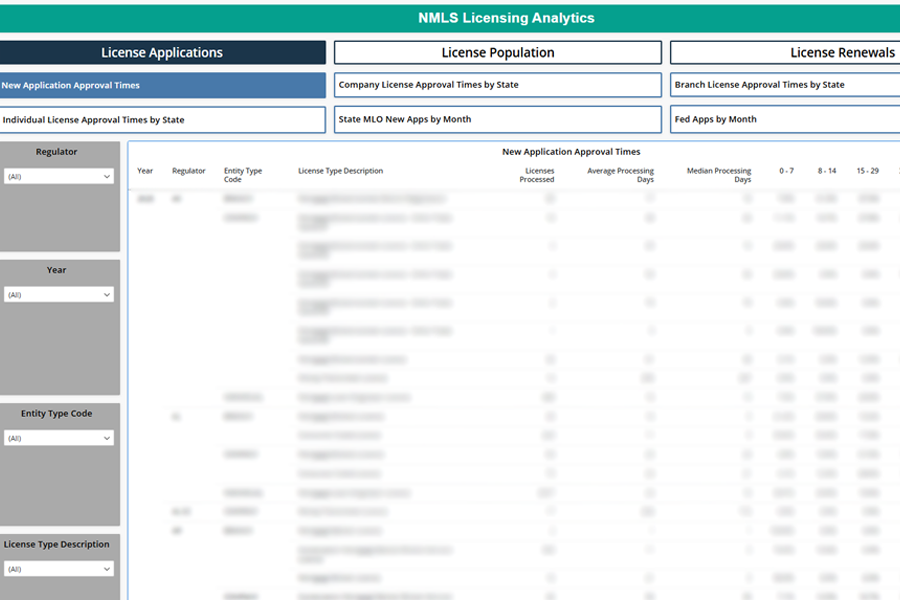
This multi-page dashboard tracks licensing activity, approval times, renewals, and MLO growth to monitor regulatory processes across states and federally.

Industry Overview

The Industry Overview section offers insights into the banking industry's landscape, covering trends in assets, deposits, bank consolidation, and small business lending. These tools provide historical performance trends and state rankings based on various ratios, allowing users to drill down into individual banks within each threshold band.

Industry Composition

The document shows how many institutions are classified as community banks and provides breakouts between state chartered and national banks. In addition, the document breaks out banks by asset size to show how different size banks are distributed.

State at a Glance

This document provides an overview of the state by indicating how key metrics have changed year over year and by summarizing the performance of banks within the state across various metrics.

Consolidated Industry

This dashboard provides aggregate information about the banking industry such as the trends in assets, deposits, charter type, and small business lending. Forty quarters of data is provided at the national level and individual state level.

State Interactive

This dashboard offers a high-level overview of state banks' performance and trends. Using the same ratios as the Outlier Report, it ranks states and shows performance trends based on ratio thresholds. Users can also drill down to view individual banks within each threshold band.

State Bank Chart Pack

This PowerPoint deck features a series of charts and graphs showcasing UBPR metrics, providing an in-depth view of the health of individual banks.

Economic

Focused on the state's economic health, this section features reports on mortgage delinquency, the Community Bank Sentiment Index (CBSI), and Data Corner blogs. These resources equip regulators with economic indicators crucial for understanding and assessing the financial environment impacting supervised institutions.

State Level Economic Dashboard (SLED)

This report provides a concise two-page overview of each state's economic forecast, covering key metrics across employment, economic output, consumer finances, and market indicators. This snapshot enables quick assessment of state economic health and trends.

Mortgage Delinquency Dashboard (DQ)

This dashboard displays seasonally adjusted delinquency rates by state for various loan types: 30-day, 60-day, and 90-day delinquencies for all loans, conventional loans, FHA loans, and VA loans.

Community Bank Sentiment Index (CBSI)

This dashboard is derived from quarterly polls of community bankers nationwide. Their economic outlook is analyzed and compiled into a single number.

Findings, Insights and Examiner Level Discussions (FIELD)

This dashboard displays the data from the Risk ID Survey, allowing users to see changes over time and compare districts to each other or the whole country. Examiners' responses are based on their observations.

Monitoring

The Monitoring section equips examiners with essential insights through peer analysis and the Risk Identification for State-Chartered Institutions (RISCI) report. RISCI provides risk scores and highlights emerging risks, enabling quick identification and focused monitoring of supervised depository institutions. This tool enhances surveillance efficiency and supports informed decision-making beyond routine examinations.

Risk Identification for State Chartered Institutions (RISCI)

This report provides a risk score and highlights key ratios for supervised depository institutions. It enables quick identification of banks with emerging risks, aiding new examiners and other state agency staff in understanding risk profiles.

Run Product
Outlier Interactive Dashboard

This dashboard highlights outliers-based color-coded thresholds on key ratios. Users can filter the dashboard to view a customized list of banks which can be sorted and exported.

Excel Risk Scoping Workbook

A quarterly Excel report that shows examiners risk metrics for state banks by CAMELS components. Users can input threshold values for each ratio.

Negative Tangible Capital

This workbook calculates Negative Tangible Capital using both the Top-Down and Bottom-Up approach both the National and State Chartered Level.

Legacy Excel Outliers Report

This workbook highlights outliers-based color-coded thresholds on key ratios. Identifies all banks that are defined as a community bank under the FDIC research definition.

Agency Management/Administration

This section provides administrative insights crucial for managing regulatory agencies. It includes the Salary Dashboard and examiner workforce estimates, supporting commissioners and regulators in strategic workforce planning and operational management.

Profile Dashboards

This dashboard graphs the data from the Profile of State Chartered Banking to compare state responses to the national average.

Salary Dashboard (Restricted Access)

This dashboard uses the latest Profile data for state employees and Office of Personnel Management data for federal employees to compare salaries between state banking department staff and their federal counterparts.

Examiner Workforce Estimate Dashboard

This dashboard collects user inputs and assumptions to analyze staffing adequacy in each state. Key assumptions include available examiner hours, vacation and training time, non-exam activity time, bank counts by asset tiers, and examination time per bank.

Financial Analysis

Diving into bank-specific analysis, the Financial Analysis section includes the Depository Deep Dive (3D) report. This immersive report offers in-depth analysis across CAMELS components, providing regulators with nearly 100 charts and graphs to assess bank performance comprehensively. Additionally, tools like Bank at a Glance provide interactive dashboards for detailed multi-year trend analysis, complementing other supervisory tools like the Outlier Dashboard and Examiner’s One-Pager.

Depository Deep Dive (3D)

This is a visually immersive +40-page report on an individual bank, featuring nearly 100 charts and graphs analyzing performance across CAMELS components.

Bank At A Glance

This dashboard provides more a detail analysis at an individual bank level and allows for multi-year trend analysis across different categories of metrics. A map of the bank branch locations is also included.

Large Bank Landscape Report

This quarterly presentation provides a high-level overview of banks with total assets greater than $10 billion.