ERSW
A quarterly Excel report that shows examiners risk metrics for state banks by CAMELS components. Users can input threshold values for each ratio, and the report counts the ratios exceeding these thresholds (exceptions) for each bank.
Supervisory Function
Monitoring
Audience
Exam Management
Industry
Bank
CSBS Excel Risk Scoping Workbook
During an in-person meeting of the Data Working Group in April 2019, working group members agreed on tools/products that would be immediately helpful to a wide range of CSBS members. The first being the Excel Risk Scoping Workbook (ERSW), an Excel-based tool, which CSBS successfully launched in August 2019. This Workbook can be used for risk scoping and bank financial analysis.
The Excel Risk Scoping Workbook allows users to:
- Compare financial performance of banks within a state
- Analyze popular metrics for each CAMELS component
- Set low, mid, and high levels for each metric
- Determine breaches of high-range thresholds
- Identify banks subject to the CRE Workprogram
- Analyze relative risk levels to scope exams
User Guide and Tutorial Video
To help examiners better familiarize themselves with the Excel Risk Scoping Workbook, CSBS has developed a user guide which can be accessed by clicking the button. The user guide explains how the workbook is organized, how to adjust the thresholds, and other features and functionality.
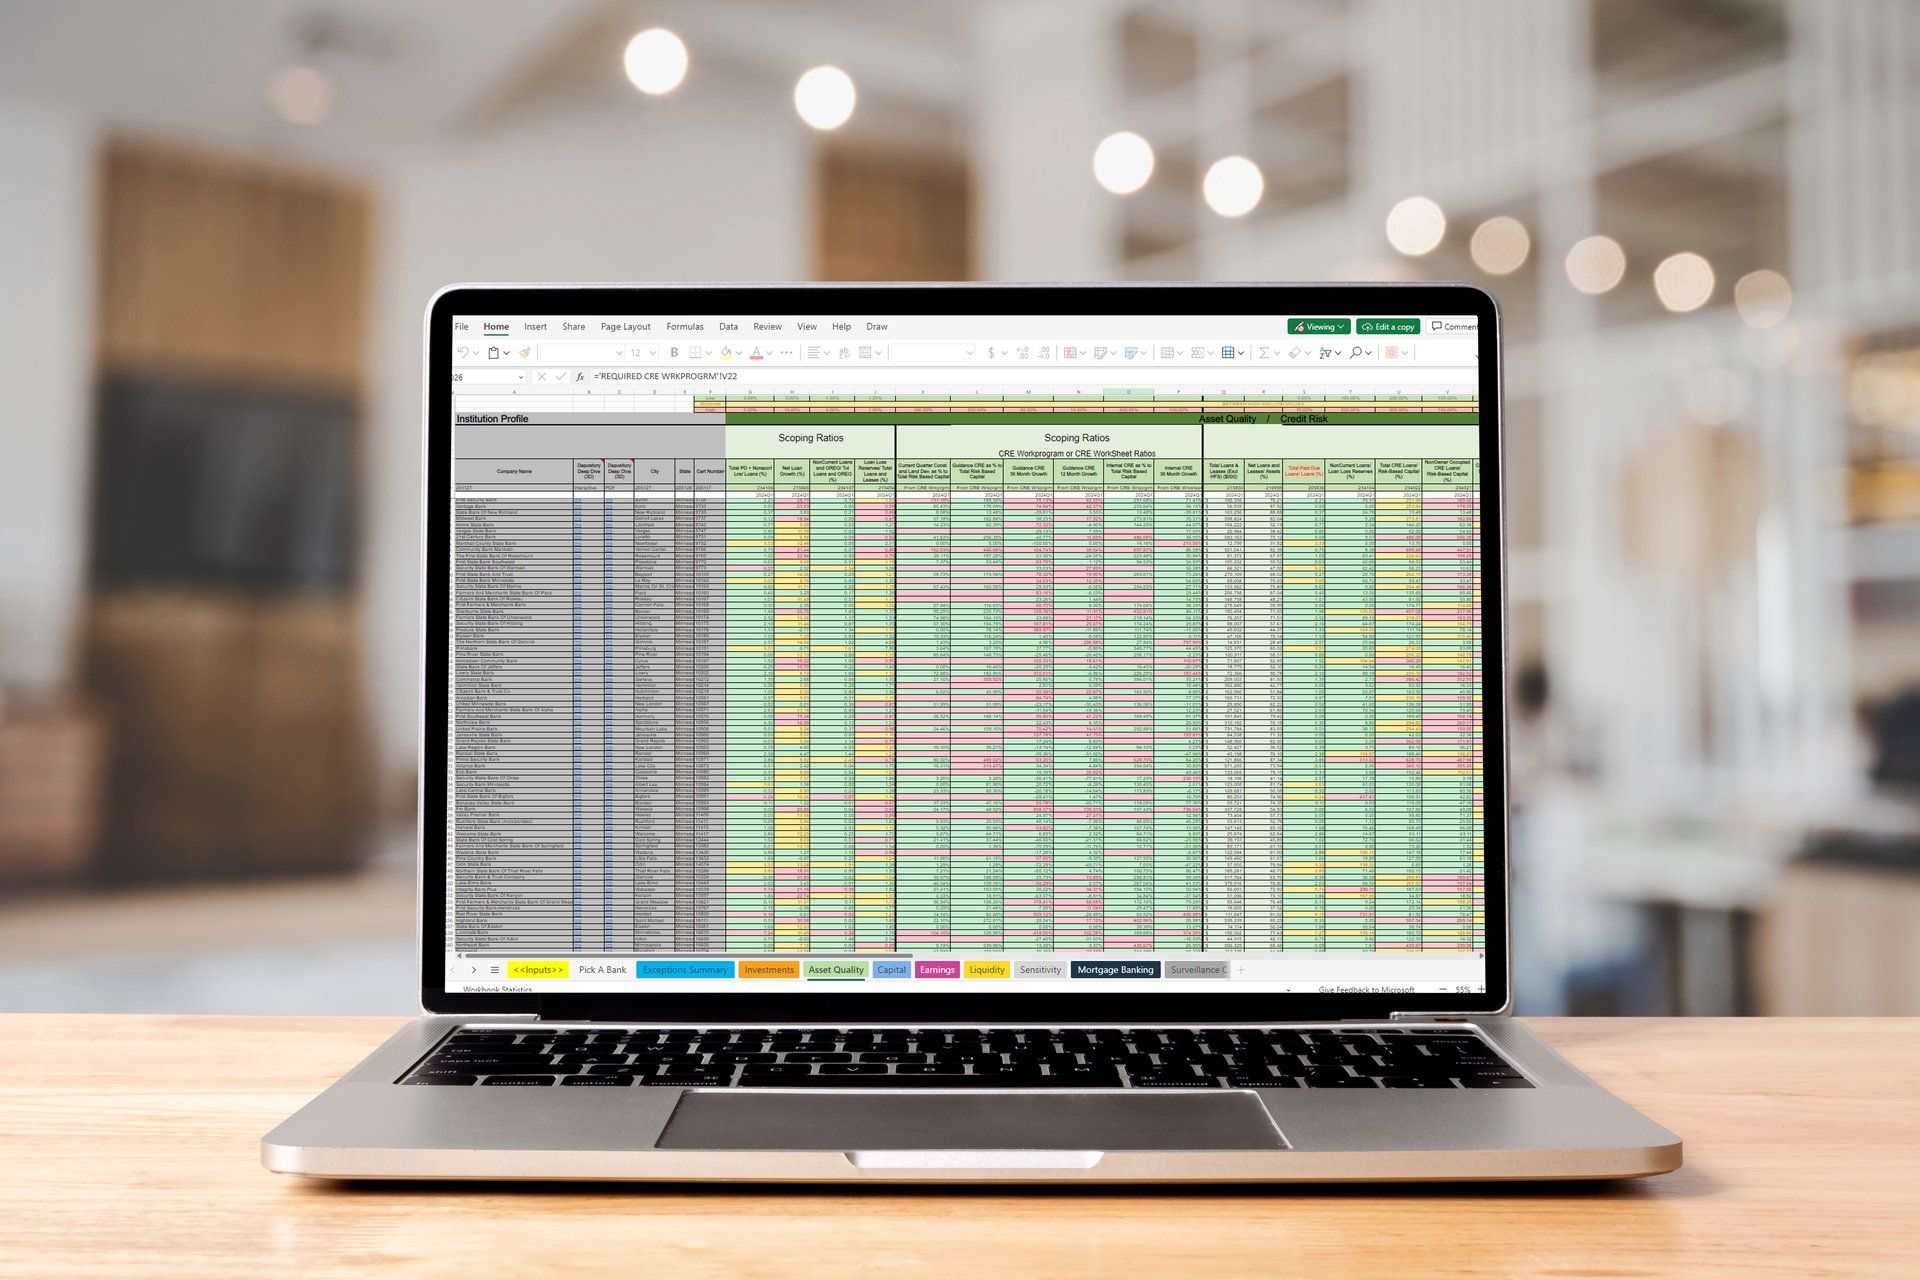
Thresholds and Exceptions
Within each tab the top 3 rows have low (green), medium (yellow) and high (red) range thresholds for each metric. Users can customize the threshold levels on the "Inputs" tab of the workbook. The metric cell colors will update automatically based on the threshold levels in the "Inputs" tab. For example, if you change a specific metric's threshold to the high range threshold which is set at 10%, all banks that exceed the high range threshold will have a red cell. Users who have adjusted their thresholds in the "Input" tab can copy the thresholds table from last quarter and paste it into the current quarter's thresholds table to avoid adjusting each threshold manually.
At the far right of each tab, there is a column named Exceptions (blue) that tallies how many times an individual bank has breached the high range threshold. Therefore, the higher the number of Exceptions a bank has, the greater the risk a bank possesses. We have also included an "Exceptions Summary" tab laying out the count of exceptions for each tab and an aggregate sum of the exceptions across all tabs.
Data Dictionary
Each data element in the Excel Risk Scoping Workbook is mapped to specific UBPR and Call Report metric. A list of the specific code mappings between the workbook and the UBPR / Call Report is available in the "Data Dictionary" tab of the Excel Risk Scoping Workbook or can be accessed below.
Download Data DictionaryFeedback
If you would like to provide feedback about the Excel Risk Scoping Workbook, or would like to suggest additions to the next version, you can submit your feedback using the form link below.
Submit Feedback